How to create Line chart in Asp.net programming:
How to create Line chart in Asp.net programming:
As we know that asp.net provide chart controls for display
data in graphically ,and there are many methods and properties for available
for changing it’s type and shape as you
like .
The Chart controls enable you to create
ASP.NET pages or Windows Forms applications with simple, intuitive, and
visually compelling charts for complex statistical or financial analysis. For
examples of how to use Chart controls, download the samples on code.msdn.microsoft.com. You can find more
samples of community content at Chart Control .
You can use data in chart as :
- Data binding.
- Data copying, merging, splitting, sorting, searching, grouping, and filtering.
- Data exporting.
- Binary and XML serialization.
- Empty data point handling.
- Support for dates, times, currency, and more.
- More than 50 financial and statistical formulas for data analysis and transformation.
The chart Appearance provide :
- 3D support for most chart types
- Automatic and manual layout and alignment management.
- 3D customization.
- Fully customizable legends.
- Automatic and manual scaling.
- Logarithmic scaling for any base.
- Intelligent data label positioning.
- Annotations, labels, scale breaks, interlaced strip lines.
The ASP.NET chart
server control enables you to create ASP.NET pages applications that have
simple, intuitive charts for complex statistical or financial analysis. The
chart control supports the following features:
- Data series, chart areas, axes, legends, labels, titles, and more.
- Data binding.
- Data manipulation, such as copying, splitting, merging, alignment, grouping, sorting, searching, and filtering.
- Statistical formulas and financial formulas.
- Advanced chart appearance, such as 3-D, anti-aliasing, lighting, and perspective.
- Events and customizations.
- Interactivity and Microsoft Ajax.
- Support for the Ajax Content Delivery Network (CDN), which provides an optimized way for you to add Microsoft Ajax Library and jQuery scripts to your Web applications.
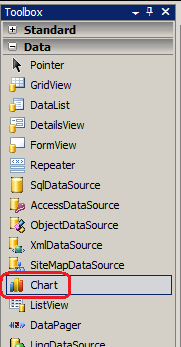
Now we plot a line chart :
<asp:Chart ID="Chart2" runat="server" Width="375px">
<Titles>
<asp:Title ShadowOffset="1"
Name="Items"
Font="Microsoft
Sans Serif, 12pt"
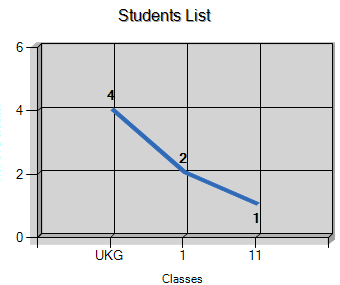
Text="Students List
" />
</Titles>
<Series>
<asp:Series Name="Series1"
ChartArea="ChartArea1"
YValuesPerPoint="10"
Font="Microsoft
Sans Serif, 10pt, style=Bold"
IsValueShownAsLabel="True">
</asp:Series>
</Series>
<ChartAreas>
<asp:ChartArea Name="ChartArea1"
BorderWidth="0">
<Area3DStyle Enable3D="True"
Inclination="10"
PointDepth="20"
Rotation="10"
/>
</asp:ChartArea>
</ChartAreas>
</asp:Chart>
Code for aspx.cs page :
private void FillChart()
{
DataSet
dsDefaulter = new DataSet();
dsDefaulter = objManagPanelGraph.SELECT_Defaulter();
Chart2.DataSource = dsDefaulter;
Chart2.ChartAreas["ChartArea1"].AxisX.Title = "Classes";
Chart2.ChartAreas["ChartArea1"].AxisY.Title = "No. Of Defaulter";
Chart2.Series["Series1"].XValueMember
= "Class";
Chart2.Series["Series1"].YValueMembers ="Number";
Chart2.Series[0].ToolTip = "Number of Student: #VAL";
Chart2.Series[0].Points.AddXY("#VALX", "#VALY");
Chart1.Series[0].AxisLabel = "#VAL";
Chart2.Series["Series1"].LegendToolTip = "";
Chart2.Series["Series1"].LabelToolTip = "#VAL";
Chart2.Series["Series1"].IsValueShownAsLabel = true;
Chart2.DataBind();
}
How to show end point real data :
Using show the real data at end point of line Wright:
Chart2.Series["Series1"].IsValueShownAsLabel
= true;
How to enable tooltip in asp.net chart controls:
For using tool tip Wright :
Chart2.Series[0].ToolTip =
"Number of Student: #VAL";
Chart2.Series[0].Points.AddXY("#VALX", "#VALY");
Chart1.Series[0].AxisLabel = "#VAL";
Chart2.Series["Series1"].LegendToolTip = "";
Chart2.Series["Series1"].LabelToolTip = "#VAL";
Result: